Monday, June 15, 2020

Transportation and Racism


The Freedom Rider

By the time you hear that siren sound
Then your soul is in the lost and found
Forever, Forever, Freedom rider

What does transportation planning have to do with the fight against racism?

Transportation has played a key role in the Civil Rights movement, from  Rosa Parks not giving up her bus seat, to the Montgomery Bus Boycott, to the Freedom Riders.  Transportation should be prepared to play a role in the current struggle against racism.

The Civil Rights struggle is not over. Racism can be measured and has endured.  The US Census reports on household wealth in the United States and differentiates that wealth by race.  If there was no racism, then wealth should be distributed evenly across all races.  However, there is a considerable gap in the reported wealth by race.  

While the inflation adjusted median wealth of households headed by whites has been increasing, the median wealth of households headed by Blacks has remained fairly constant during the reported period. The median wealth of white households has been growing at a Compound  Annual  Growth  Rate, CAGR, of 2.66%, the median wealth of Hispanic Households has been growing at a CAGR of 2.35% while the median wealth of Black households has been growing at a CAGR of only 0.52%.

While there was a bubble in median wealth during the housing bubble of the early 2000s, that  bubble was experienced by Black and Hispanic as well as White households and all households have returned to the trend before that bubble.

Transportation forecasts and decisions need to acknowledge this disparity to ensure that transportation does not exacerbate this gap.

Rich and Poor


Ain't We Got Fun

The rich get rich and the poor get poorer        
In the meantime, in between time       
Ain't we got fun?

The richer are getting richer.  But are they getting so rich that it has become a problem?

Nature hates extremes.  It finds a way to return to an equilibrium and a statistically normal distribution.  It is our choice whether that is a gradual or catastrophic return.  A gap between rich and poor is part of society.  Going back to ancient times, Jesus said, “The poor you will always have with you” (Matthew 26:11)  While the poor may always be with us, it is not a Christian thing to create more poor by transferring wealth to the rich.

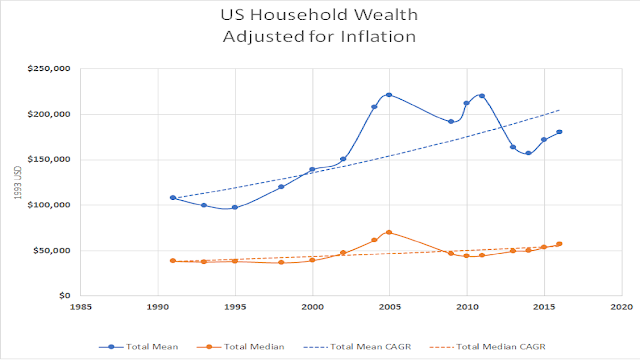
The US Census reports annually on income, but it reports irregularly on household wealth, based on a statistically chosen panel.  Those results are reported in current year dollars.  To adjust for inflation, the reported values have been adjusted by the Bureau of Labor Statistics Consumer Price Index to 1993 USD.  


Figure 1 includes both the mean and median adjusted for inflation.  The mean is easier to compute from totals of data, while the median requires access to the all of the data.  However, the median corresponds more to what people think of as the “average”, the value at which 50% are higher and 50% are lower.  When the distribution follows a normal statistical distribution, the traditional “bell shaped” curve, the mean and the median are identical.  However, when the distribution that is being measured is skewed, there can be a difference between the median and the mean.  The mean inflation adjusted wealth is growing at a Compound Annual Growth Rate, CAGR of 2.6% , while the median CAGR is only 1.4%.  This difference between the mean and the median, demonstrates at least that the richer are getting richer and the gap between the mean and the median is getting larger.  Hopefully we will do something to address this inequity before there is a catastrophic response.

Thursday, June 11, 2020

Remembering versus Glorifying History


Do You Hear The People Sing?

Singing a song of angry men?
It is the music of a people
Who will not be slaves again!

 DJT ( and Santayana) are correct. "Those who don't remember history are doomed to repeat it".  But there is a difference between remembering and glorifying.


The protests since the end of May have an echo in history.  In happens whenever one group tries to enrich itself by enslaving another.  The shackles may be iron, as they were before the US Civil War, or economic, as they were in France at the time of Les Misérables.  Neither set of shackles should be glorified.  In recent times in the United States, the shackles have also been economic.  While total wealth and income has been increasing, it has been concentrated in just a few, while the majority  has seen their income and wealth stagnant or falling. 

It is not an imagined inequality.  It can be shown that inequality has been increasing in America both by income and by wealth.  This is in contrast to the conditions in the rest of the world, including places where inequality has long endured.  The gap between rich and poor is decreasing within most other countries. The gap in the United States has been increasing and arguably has reached a critical point.  Those of us who are invested in this system, must hope that the angry men will be satisfied with a reform of that system which we will make by remembering and addressing our wrongs, and not that the angry men will demand the  destruction of that system.

Sunday, June 7, 2020

Who Can Work From Home?


It Ain't The Meat (It's The Motion)

It ain't the meat, it's the motion
It's the movement, it isn't the stock

Working from home is not available to everyone.  Knowing  the employees by industries isn’t what is important. It is the occupation within those industries that make working from home possible.

Working from home, e.g. telecommuting, has been promoted as a key strategy for sustainability, reductions in energy consumption, cleaner air, etc.  However, if there is one thing that the COVID‑19 pandemic has taught us is that not everyone can work from home.  Classifying industries as essential is tempting, particularly since travel demand models may already classify employment by industry type (e.g. Office, Service,  Retail, Manufacturing, etc.).   However, it is really the occupation of the employee, and not the industry that determines who can work from home.

A Transportation Equipment  Manufacturing Firm (NAICS Code 336) might be non-essential, and its employees could work from home.  However, while a lawyer (Occupation Code 23) or an accountant (Occupation Code 13) employed at that Transportation Equipment Manufacturing firm might be able to work from home,  a production employee (Occupation Code 51) at the same firm would  be unable to work from home.  This assumes that the firm is in business.  If the industry itself is shut down, then there may be no employment for the lawyer or accountant working at that firm.

The Bureau of Labor Statistics, BLS,  provides data of Occupations by Industry by area type. That data indicates that perhaps 50% of the total employment in the country is employed in an occupation that  can work from home (excluding self employed and employees in agriculture).  The BLS data does not provide breakdowns by industry in metropolitan areas, but the employees in all industries might also be 50% in occupations that might work from home.

There is a difference between being an essential industry and an essential employee.  Not all essential employees work in essential industries, and not all employees in essential industries are themselves essential.

Friday, June 5, 2020

Income Response to Tax Rates

Taxman

Let me tell you how it will be
 There's one for you, nineteen for me
  Cause I'm the taxman yeah, I'm the taxman

Taxes should be a way to grow the economy, not to  increase inequity.

No  one likes paying taxes.  Taxes are levied to raise revenue for governments. In the United States, the principal source of federal government revenue is the income tax.  However, the purpose of the income tax code is not only to collect revenue.  It is enacted to promote economic growth, while arguably not unnecessarily adversely affecting various economic sectors.  Income inequality is a measure of how the poor (lower income percentiles) compare to the rich ( upper income percentiles).  A proposed measure of income inequality is the ratio of Mean household income (i.e. total income divided by total households), divided by Median household income ( i.e. the income above, or below, which 50% of the households occur).  For a perfect normal distribution of household income, the mean and median would be the same. 

A measure of success of the income  tax code might be that total income increases, but the income inequity does not increase.  The Federal Reserve Bank of St Louis provides Mean and Median household incomes, as reported by the US Census.  The reported Mean and Median household incomes are shown in Figure 1.

Figure 1 Mean And Median US Household Income: All Years Current Dollars


If the goal of the Tax Acts were to increase economic growth, those Acts have fallen below an Compound Annual Growth trend line established by income from all years.  Also, from that figure, the  gap between Mean and Median household incomes has been increasing over time.
To account for inflation, the reported household incomes were adjusted by the Bureau of Labor Statistics Consumer Price Index, CPI,  to convert incomes to 1967 dollars ( any year could be used as an index, which would change the values on the y-axis, but would not change the data or curves because the impact of inflation would be the same.) These results are shown in Figure 2.

Figure 2 Mean and Median US Household Income, Adjusted For Inflation, By Tax Act


The major Tax Acts during this period are shown, which regress very well to the reported household incomes.  The analysis does not include the impact of the Tax Cut and Jobs Act of 2017 because it was signed in law in December of 2017 and not enough time yet has occurred to compute its impact on household income.  Shown in Table 1 is the Compound Annual Growth Rate, CAGR,  computed for the reported respective mean and median household incomes during these periods. If the intent of the Tax Acts was to promote economic growth, then arguably  growth has been less during each of Tax Act periods.  What has occurred is that the gap between mean and median incomes has increased during the period of these Tax Acts.

Table 1 Growth Rate During Periods Of Tax Acts.
pre 1981
1981-1990
1991-2001
2002- 2018
Mean Income
CAGR
2.30%
1.63%
1.93%
0.40%
Median Income CAGR
2.23%
1.21%
1.46%
0.13%

While the Tax Acts were adopted during, or immediately following, economic downturns, recessions, economic downturns, and recoveries have also occurred during periods with no changes to the tax codes.  The official National Bureau of Economic Research beginning and ending dates of recessions are shown in Table 2. There have been more recessions than there have been changes to the Tax Code during the reported period.  Based on the reported incomes, it is possible to recover from a recession without  any corresponding changes to the Tax Code.

Table 2 NBER Reported Recessions Corresponding to the Years In Figures 1 And 2

Beginning date
Ending date
1953-07-01
1954-05-01
1957-08-01
1958-04-01
1960-04-01
1961-02-01
1969-12-01
1970-11-01
1973-11-01
1975-03-01
1980-01-01
1980-07-01
1981-07-01
1982-11-01
1990-07-01
1991-03-01
2001-03-01
2001-11-01
2007-12-01
2009-06-01


Income Equity

A Bohemian Rhapsody

Is this the real life,
 Is this just fantasy?

Income equity is a real phenomena based on real data, not just the product of fantasy,

Many measures have been proposed to measure income inequality: the Gini coefficient, the Atkins coefficient, various percentiles of income, etc.  If Standard Deviations of household income were available, the Median, Mean, and Standard Deviation of those household incomes could be used to compute the Skew of household income compared to a normal distribution of household income.  The Standard Deviations of household incomes are not often reported, while the Mean and Median household incomes are commonly reported. Zimmerman[1] suggested comparing the Mean and Median household income as a measure of equity. 

The LIS Cross-national data Center in Luxembourg reports on various economic measures .  It reports Median and Mean household incomes for 51 countries during the period 1967 to 2016[2].  An Income Equity Index (Mean income divided by Median income) was computed from this data.  The results of this analysis are shown below.
  
Figure 1 Income Equity Index by Country


By inspection, an equity index of less than 1.2 appears to be common in most countries, particularly in the more developed countries.  If income followed a normal statistical distribution, the  Mean would be equal to the Median and the Income Equity Index would be 1.0.  However, this is only possible if negative incomes were also possible.  Since income less than 0 are not reported, an Income Equity Index of greater than 1 should be expected.

In most countries, the Income Equity Index is either decreasing or stable over the period of the LIS data. Only four countries have a forecast 2018 Income Equity Index greater than 1.2 where the Income Equity Index is also increasing over time.  In two of those countries, Lithuania and Romania, this forecast is based on only 2 years of data and the forecasts for these countries are not statistically significant.  The forecasts in the remaining countries, the United Kingdom and the United States are based, respectively, on 13 years and 12 years of data and are statistically significant. This historical data is shown graphically in Figure 2.

Figure 2 Income Equity Index: United Kingdom and United States
. 
For both countries, the largest and fastest increase in the Income Equity Index occurred during the period between 1980 and 1994 although the Income Equity Index is still increasing after this period. A common thread in both counties during this period is Arthur Laffer, who served as an economic advisor to both the Reagan and Thatcher administrations

Transit as a Public Good


The Best Things in Life Are Free

The sun belongs to everyone
The best things in life are free

Is transit a public good, or a private good?


Is transit a public good that should be provided to the general public?  This question becomes more important since transit is likely to be adversely affected by the COVID-19 recovery while at the same time it is essential for the commute trip of essential workers.

Economists have found it useful to categorize goods using definitions of rival, if some one uses a good then that good can not also be used by another, and  exclusive, a price can be charged for using that good.  Private goods are exclusive and rival.  I am charged for eating a piece of food, and if I eat that food no on else can eat that food.  Public goods are non-exclusive and non‑rival.  No one can charge me for basking in  sunshine and my basking in sunshine  doesn’t prevent some one else from basking in that same sunshine. 

Economists also categorize goods that are rival and non-exclusive as common resources, such as fishing grounds.  For example, no one charges for catching a fish,  but my catching a fish means no one else can catch the same fish.  Economists categorize goods as natural monopolies if they are exclusive and non-rival.  I can be charged for watching cable TV, but my watching cable TV does not prevent some one else from watching that same cable TV.


Transit is an example of a natural monopoly, in fact the original transit systems were formed as licensed private natural monopolies.  In my home of Massachusetts, the MBTA, the public transit authority, is a successor to the private Boston Elevated Company.  Natural monopolies are also categorized by having high fixed costs and low marginal costs.  The fixed cost of a subway line and its trains far exceed the marginal cost of adding an additional rider.  Governments grant a licensed monopoly to transit systems to protect that high fixed investment.

While transit is exclusive, in that while a rider is charged a fare for using transit, it is only partially non‑rival.  My riding transit does not prevent some else from riding transit, but the space in the transit vehicle itself is rival.  Movie theaters are another example.  A movie itself might be a non‑rival good, e.g. my watching a movie does not prevent someone else from watching that same movie, but the seats in the theater showing that movie are rival e.g. if some one is occupying a seat no one else can occupy that same seat.

The problem is treating rival and exclusive as an either/or proposition.  They are not like pregnancy. You can be a little bit rival, but you can’t be a little bit pregnant.

Transit itself might be a more like a public good.  While it is a natural monopoly, it is a public natural monopoly.  The fare that makes it a natural monopoly, exclusive, is a public choice, and most likely reflects political and not economic values.  Transit itself is non-rival; my using transit doesn’t prevent someone else from using transit, while the space on a transit vehicle is rival; if I occupy space on a transit vehicle no one else can occupy that same space.

Common Resources are regulated to prevent the “tragedy of the commons”.  Fishing quotas and licenses are imposed by governments to make that common resource more exclusive .  There is no economic problem with subsidizing transit and treating it more like a public good. The fact that transit has a cost doesn’t mean that it should be treated only as a private good or a natural monopoly.  The subsidy of transit for the commute of essential workers as a public good is a government, public, choice.