Friday, June 26, 2020

Risk and Business


Risky Business

I'm afraid we've gone and laid it on the line 
      
It's a risky business

If the business of government is really business, then why can’t government be run more like a business?

The answer is in the perception of risk.  Risk has two components: likelihood and consequence.  If you get the risk wrong, and the likelihood was high, but it had minimal consequences, then that is no big deal.  If the consequence is dire, but the likelihood is low and it did not happen, then that also is no big deal.  If an event happens even though the likelihood was small, and the consequences are dire, and you did not properly consider the risk, then God help you.

That is why there are insurance actuaries. They set insurance rates by quantifying the likelihood of something bad happening and valuing the consequences of that event. And that is why insurance is purchased, not because you expect something bad to happen, but you want to mitigate the consequences if something bad happens.

Many businesses do not purchase insurance, instead they self insure.  They accept the consequence that they might go out of business if the if the worst happens.  The problem with going out of business, bankruptcy, is that it impacts the creditors and customers of that business as well. Society does not have the option of declaring bankruptcy, since the customers and the creditors are society.  Governments can declare bankruptcy only if the customers and creditors are another government, if those governments agree to take on the customers and costs of the old government.

If businesses or businessmen do value risk properly then, yes governments can be run as that business.  But a string of bankruptcies and business failures should be a warning sign that the business or businessman does not understand risk.  A child learns not to pick up a hot object by experience.  If it never learns because it assumes nothing it touches will burn, then they might be lucky, but have not learned this lesson.  You learn from mistakes. You do not  keep doing so many things in the hopes of finding something in which you will make no mistakes, incur no consequences.

Friday, June 19, 2020

International Trade


Trade Winds

And we're caught in the trade winds
The trade winds of our time

Can the growth in international trade affect the US economy?

According to the United Nations Center for Trade and Development, global trade (exports) have grown from $61 Billion US Dollars in 1960 to a value of almost $20 Trillion US Dollars in 2018.  The US Dollar serves as the international reserve currency and has served this role, exclusive of gold, since 1971.  The Gross Domestic Product of the United States is also $20 Trillion  in 2018,  about 12% of which is exports.  Even if the US trade dropped to zero, this international trade between the countries would still require US Dollars.

A question becomes what is the future of international trade?  Fitting a Compound Annual Growth Rate curve to the trade from 1960, would forecast that the Global Trade in 2030 could be $85 Trillion.  However, if the pattern of recent years is fit to a logit curve, this suggests that international exports could amount to $24 trillion in 2030.


This difference in forecasts has implications for the domestic monetary policy of the Federal Reserve Bank.  While the Federal Reserve can control the domestic economy, they have little ability to affect international trade. International trade, which includes US exports, is projected to be as large as the US domestic economy, if not larger.  This has major implications for domestic national monetary policy.  

This conflict between domestic monetary policy and the international trading when a domestic currency is used as the international reserve currency was anticipated in the 1960s by the Belgian-American economist Robert Triffin. He pointed out that the country whose currency is the global reserve currency, that foreign nations wish to hold, must be willing to supply the world with an extra supply of its currency to fulfill world demand for these foreign exchange reserves.

International trade might be equal to the US domestic GDP by 2030, or might be several times greater than this amount.  In any event,  the continued use of the US Dollar as a global exchange has become a serious problem,  It remains to be seemed if the change in trade winds is a problem that can blow down the US economy.


Thursday, June 18, 2020

User Optimization

The Winner Takes It All

 The winner takes it all
The loser has to fall
 It's simple and it's plain
Why should I complain 

You should complain because the winner taking it all is only one way that a game can be played. 

Everyone loves a winner.  However, whether the winner is a society or an individual depends on one’s strategy and the rules of the game.  In Games Theory there are two major strategies: User Optimization and System Optimization.  The first strategy could be characterized as “I do what is best for me”.  The second strategy could be characterized as “All for one and one for all."  The first strategy involves finding the solution that is best for that individual.  The second looks at the sum of the solutions by all of the individuals in that system and picks the set of solutions that are best for that system. 

The System Optimal solution requires that some individuals  “take one for the team”, that is they must accept a solution that is not best for them, because that is the best solution for society.  A System Optimal solution has been shown to be different than a User Optimal solution but may not be intuitively obvious.  Individual User Optimal solutions will be chosen when there are no constraints on an individual.  If one user chooses a solution that is best for him, every other similar individual should make that same choice.  However, the aggregate of these solutions is not the System Optimal solution.  For example, when choosing a route, each user will choose the  route that maximizes their utility, minimizes their time and cost.  In my discipline of transportation planning, this is known as Wardrop’s Principle.  A misconception that the sum of these User Optimal solutions is the System Optimal solution has led to Braess' paradox, where eliminating a link which forces travelers to change their paths could result in a better system utility. If the User Optimal and System Optimal solutions are accepted to be different, then there is no paradox.

Humans are a social animal, but they are also individual animals.  Societies prefer team, group,  sports.  The Super Bowl generates more viewers and more interest than the individual championships in track and field.  The best player in a team sport may not play on the best team.  Giannis Antetokounmpo might have been the NBA’s Most Valuable Player in 2019, but in that year the Toronto Raptors, not Giannis’ Milwaukee Bucks, won the NBA Championship.   

There is a way to make the user optimal solution be closer to the system, societal, optimal solution. That is by charging an extra utility for using a certain item.  Economists call this adding a shadow price. It is one of the reasons why tolls are charged on public roads. Customs, Rules, Regulations, and Laws are among the ways that society imposes these additional costs for using an item.  When this shadow price is added to the actual price, then the individual user chooses a solution that considers this shadow price.  The shadow prices that are added can be chosen such that the User Optimal solution becomes closer to the System Optimal solution.  The problem is that the society that imposes the shadow prices is also the same society that collects and distributes these shadow prices.  Society must trust that the shadow prices are imposed for the good of society and not the good of the those in charge of society.  It becomes a matter of “Who Watches the Watchmen/Quis custodiet ipsos custodes?


Wednesday, June 17, 2020

Is Inflation Real?

Just My Imagination

I tell you I can visualize it all
This couldn't be a dream for too real it all seems
But it was just my imagination
 Once again runnin' way with me.

Inflation seems real, but it may be just our imagination.

Price inflation seems real.  Every year things get more expensive.  But it hasn’t always been this way.  See my earlier posting. https://dbeagan.blogspot.com/2018/08/the-happening-riding-high-on-top-of.html.  There was a time when prices seemed stable.  Prices rise because demand is increasing at a faster rate than supply.  Demand is growing because the economy is growing.  Everyone knows this, including the suppliers.  They should increase supply at the rate of demand in order to increase their profits. They know how much demand is growing, or is there some other reason why there is still inflation?

The US dollar serves as the medium of exchange in the United States, but also serves as the de facto international currency.  It did not have to serve as the international reserve currency.  John Maynard Keynes proposed at the 1946 Bretton Woods Conference that the international currency exchange should be the bancor, French for bank gold.  This was rejected in favor of a system a system of pegged exchange rates ultimately tied to physical gold in a system managed by the World Bank and International Monetary Fund, IMF. In practice, that system implicitly established the United States dollar, USD, as a reserve currency convertible to gold at a fixed price on demand by other governments. The dollar was implicitly established as the reserve by the large trade surplus and gold reserves held by the US at the time of the conference.

But these conditions would not endure for ever.  By the early 1970s, the US trade surplus was no more, and, in 1971, Nixon decoupled the US dollar from gold. This made the US dollar the explicit, not just the implicit, international currency.  A period of monetary inflation ensued, but this is only inflation based on the previous year. In fact, the Consumer Price Index, a measure of inflation, has consistently risen since that time, even while annual inflation has been declining.  Since 1971, the CPI appears to have been growing at a linear rate.  While Year Over Year, YOY, inflation from 2018 to 2019 was 1.8%, inflation from 1971 to 2019 was 531%.  Inflation reached a maximum annual inflation of 13.5% in 1980.  By contrast a linear regression of the CPI, assumes that much of the inflation happened immediately in 1971 when it was forecast to be a maximum of 21%, but by 2019, its forecast annual inflation drops to 1.8%, and has increased from 1971 by 549%.

Why is there any inflation at all? As stated in the  earlier posting, this is because of the Triffin dilemma. Since the USD is the international reserve currency, trade between, for example, China and Nigeria, even though it does not involve the United States, may require USD.  The growth in international trade according to World Trade Organization is forecast to be 1.6% in 2019.

The United States Federal Reserve Bank has been adjusting US monetary policy to reach its goal of 2% annual inflation but has admitted failure.  I am proposing that if the USD is the international trading exchange, then “inflation” is a consequence. If the USD was NOT the international exchange, then inflation might be just my imagination, and 0% would be the real inflation, which is certainly better than the Federal Reserve’s 2% goal.

Tuesday, June 16, 2020

Classification Systems


Horse in Striped Pajamas


No, that’s not what it is at all 
That's an animal people call a zebra
  I see, but it still looks like a horse in striped pajamas to me

There is no single best classification system, it just must be useful to you.

And I thought truck classification systems were screwed up!  It is nothing compared to product classification systems.  Humpty Dumpty was only partially wrong when he was talking to Alice in "Through the Looking Glass".  The word used to describe a thing may mean what I choose it to mean, but the word, or classification system, that I use depends on my purpose.  A shipment of household cleaner can go by many classifications.  A retailer might describe it by the UPC Code on the items in the shipment.  A customs official might use the Harmonized Series code to see what tariffs should be collected on that item.  The railroads might use the Standard Transportation Commodity Code to determine what price to charge for transporting that shipment by rail.  The US Department of Transportation might use the Standard Classification of Transported Goods to report on multimodal shipments.  The US Army Corps of Engineers might use the Public Monitoring System code if that shipment was transported by water.  An emergency first  responder might refer to that shipment by its United Nation’s Hazardous Material code.  An economist might refer to the industries that Make or Use that product.  Etc.

Each one of these classification systems is appropriate for the purpose that is intended, but each one is different.  An economist might have a classified a product but used a system that a hazardous material responder would like to use.  It is too much to expect that a single code could be developed, but in order to transfer information from one discipline to another, it is desirable that correspondence tables, crosswalks, be developed among those classification systems.  That way information developed for use by customs officials can be used by economists, and so on.  Those establishing systems should at least develop a crosswalk to one other commonly used system.  If enough correspondence systems are developed, then perhaps one of those tables could serve as a Rosetta Stone to translate that information from one from those who have information to those who would like to use that information.  That way you can still refer to a “horse in striped pajamas” if that is what makes sense to you.

Monday, June 15, 2020

Transportation and Racism


The Freedom Rider

By the time you hear that siren sound
Then your soul is in the lost and found
Forever, Forever, Freedom rider

What does transportation planning have to do with the fight against racism?

Transportation has played a key role in the Civil Rights movement, from  Rosa Parks not giving up her bus seat, to the Montgomery Bus Boycott, to the Freedom Riders.  Transportation should be prepared to play a role in the current struggle against racism.

The Civil Rights struggle is not over. Racism can be measured and has endured.  The US Census reports on household wealth in the United States and differentiates that wealth by race.  If there was no racism, then wealth should be distributed evenly across all races.  However, there is a considerable gap in the reported wealth by race.  

While the inflation adjusted median wealth of households headed by whites has been increasing, the median wealth of households headed by Blacks has remained fairly constant during the reported period. The median wealth of white households has been growing at a Compound  Annual  Growth  Rate, CAGR, of 2.66%, the median wealth of Hispanic Households has been growing at a CAGR of 2.35% while the median wealth of Black households has been growing at a CAGR of only 0.52%.

While there was a bubble in median wealth during the housing bubble of the early 2000s, that  bubble was experienced by Black and Hispanic as well as White households and all households have returned to the trend before that bubble.

Transportation forecasts and decisions need to acknowledge this disparity to ensure that transportation does not exacerbate this gap.

Rich and Poor


Ain't We Got Fun

The rich get rich and the poor get poorer        
In the meantime, in between time       
Ain't we got fun?

The richer are getting richer.  But are they getting so rich that it has become a problem?

Nature hates extremes.  It finds a way to return to an equilibrium and a statistically normal distribution.  It is our choice whether that is a gradual or catastrophic return.  A gap between rich and poor is part of society.  Going back to ancient times, Jesus said, “The poor you will always have with you” (Matthew 26:11)  While the poor may always be with us, it is not a Christian thing to create more poor by transferring wealth to the rich.

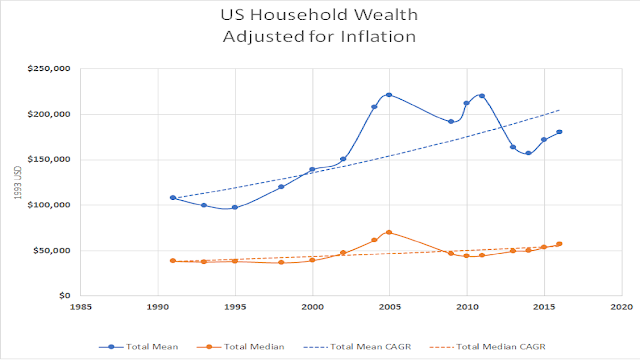
The US Census reports annually on income, but it reports irregularly on household wealth, based on a statistically chosen panel.  Those results are reported in current year dollars.  To adjust for inflation, the reported values have been adjusted by the Bureau of Labor Statistics Consumer Price Index to 1993 USD.  


Figure 1 includes both the mean and median adjusted for inflation.  The mean is easier to compute from totals of data, while the median requires access to the all of the data.  However, the median corresponds more to what people think of as the “average”, the value at which 50% are higher and 50% are lower.  When the distribution follows a normal statistical distribution, the traditional “bell shaped” curve, the mean and the median are identical.  However, when the distribution that is being measured is skewed, there can be a difference between the median and the mean.  The mean inflation adjusted wealth is growing at a Compound Annual Growth Rate, CAGR of 2.6% , while the median CAGR is only 1.4%.  This difference between the mean and the median, demonstrates at least that the richer are getting richer and the gap between the mean and the median is getting larger.  Hopefully we will do something to address this inequity before there is a catastrophic response.