Natural Gift
You don't
have to be a genius to find
All the hidden potential deep in your mind
You don't have to know about nuclear physics
Know all the formulas and vital statistics
You don't have to be an intellectual, you don't have to be a scientist
To use your natural gifts, you got natural gifts, yeh
Use your natural gifts, you got natural gifts
Coming soon
to a math journal near you. Hyperbolic statistics!
The first moment of observations about the origin
is:
m1=(1/n) ∑fi xi, , summed from i=1 to k
where the index i is the ith grouped
observation, fi is the frequency of that observation, (e.g. if
there are 3 observations of 2, this makes 3 the frequency of the group of observations
that is 2), k is the number of groups, and n is the number of observations.
This is also the formula for the arithmetic, computed, mean, x̄ , often called the average. The average is more
properly defined as the centrality of the normal. The median is the centrality,
but in a normal distribution the mean is also equal to the median. Therefore
saying the average is the mean is only true when the observations are also normally
distributed.
The second moment about the about the computed mean,
often called the variance, is:
m2=(1/n) ∑fi (xi- x̄)2 summed
from i=1 to k
The square of the Standard Deviation is also often defined
as the variance. In flat Euclidean space, the Standard Deviation, S.D., is:
Euclidean S.D.=square
root(∑fi (xi- x̄)2)/(n-1))
However this is only true in Euclidean space since it
relies on Pythagoras’ Theorem for a hypotenuse. On a non-Euclidean surface, this
is not the correct formula for the sum of squares. For example, the shortest
distance between two points, a, and b, on the spherical surface
of the Earth is the Great Circle Distance. According to Pythagoras’ theorem for
a spherical surface, where R is the radius of
the surface, e.g. the Earth, this is R*cos-1(cos(a/R) *cos (b/R)).
When the distance between points a and b is very small compared
to the Radius, e.g. of the Earth, of the surface, then this is virtually
indistinguishable from the traditional Pythagorean theorem.
If the surface is hyperbolic,
not spherical or flat, then the shortest distance between two points is
cosh-1(cosh(a)*cosh(b)).
If a is defined as the summation of the deviations about the mean, and b is defined as 0,
then the Hyperbolic Standard Deviation is
(cosh-1 (cosh(
(∑fi (xi-x̄))/n)))^(1/2)
while the Euclidean, flat, S.D is as defined before.
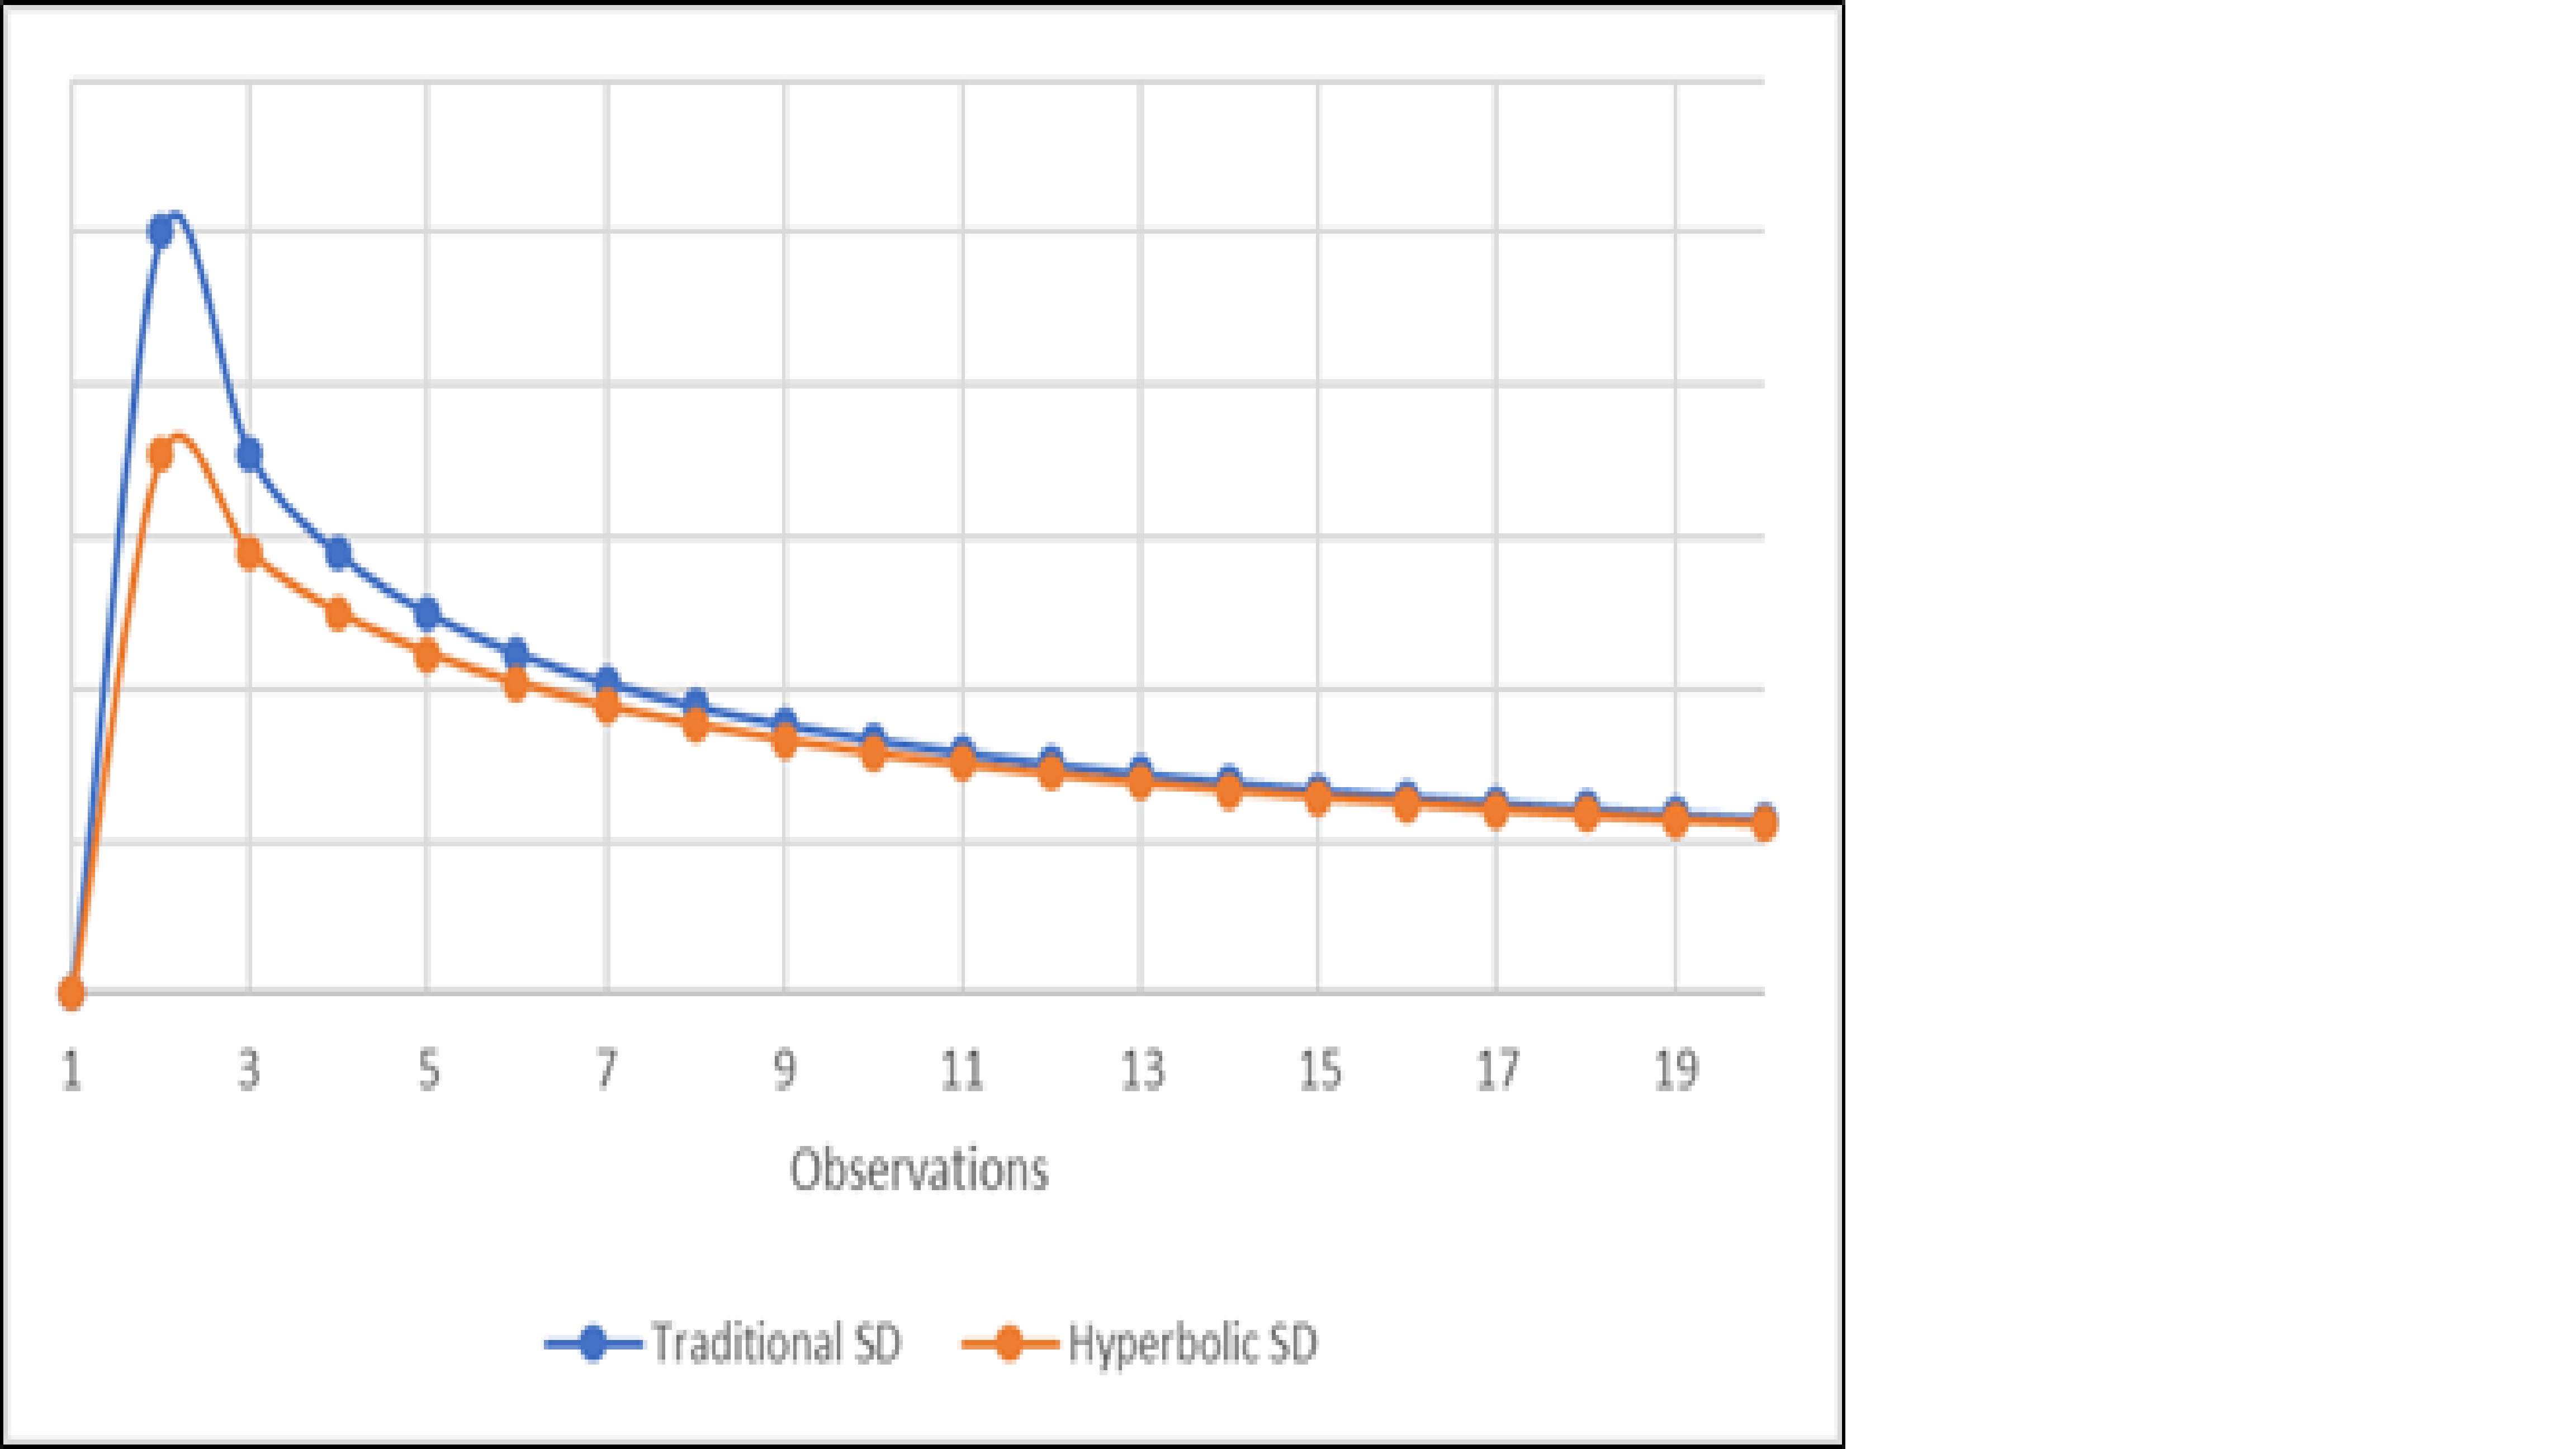
When the number of observations, n, is very large, and
the sum in the second moment is not zero then there is virtually no difference
between the hyperbolic S.D. and the flat, Euclidean traditional S.D. This does
not mean that the difference is not real, just that in many applications there
is no observable difference between the hyperbolic S.D. and the traditional S.D.
Even when the sum of the square of the differences between the observations and
the computed mean is virtually indistinguishable from zero, the difference
between the traditional and hyperbolic Standard Deviation is virtually indistinguishable
for large n , as shown in the figure below.
With a roll of a traditional six-sided die, there are six possible outcomes, 1 though 6, which if the die is not loaded should follow a normal distribution. The mean outcome is 3.5. The median outcome is 3.5. The Euclidean Standard Deviation is 1.7. This requires that according to the 68/95/99 rule for normal distributions that 99.7% of the outcomes should fall between the mean minus 3 SD and the mean plus 3 SD. According to the traditional SD, this requires that 99.7% of the die roll outcomes should fall between -0.6 nd 7.6. While this is true, a more useful metric might say that 100% of the outcomes fall between 1 and 6. This requires the variance, σ2, to be .694 and the square root of the variance, σ, to be .833. Then 100% of the observations fall between the mean ± 3σ. The Hyperbolic Standard Deviation of a six-sided die role is .34. According to the Hyperbolic SD, this requires that 99.7% of the die roll outcomes should fall between 2.48 and 4.56, which is also the incorrect variance.
The reason that the square of a Standard Deviation might
not be σ2, the
true variance, is because of error. The true mean is not necessarily the computed
mean because the computed mean can contain error.
x̄=μ+ ε¯
x̄ = The computed
mean, (1/n) ∑fi xi, , summed from i=1 to k;
μ = The true mean;
ε¯ = The mean error, (1/n) ∑ εi, , summed from i=1 to k.
The moments about the computed mean will only have non-zero
values if the computed mean is NOT equal to the true mean. This is because (1/n) ∑fi
(xi- x̄)r
summed from i=1 to k is equal to zero for every
moment r when there is no error. If
there is no error, then the square root of the second moment about the mean should
not be solved using Euclidean mathematics, etc. The computed Euclidean Standard
Deviation added the Bessel adjustment, n-1, in order that the square of
the Euclidean Standard Deviation be closer to the True Variance. The Bessel adjustment
is only necessary if the Standard Deviation is computed using Euclidean
geometry. It should be computed using non-Euclidean hyperbolic geometry. If the
computed mean is the true mean, then the variance should be other than the square
of the Standard Deviation.
It is suggested that the Standard Deviation for a normal distribution where the mean error is zero, appears to be 0. This is also not the variance squared, σ2, but this is the limit of the Euclidean Standard Deviation when the number of observations approaches infinity. This suggests that the 100% of the values of a traditional six-sided die, where this hyperbolic SD is 1.90, occurs between -2.2 and 9.2. Thus it is suggested that the square of the Standard Deviation is NOT the variance. It is suggested instead that the high observation and the low observation be identified. If the distribution is negatively skewed then the computed mean minus the lowest value minus .003 divided by 3 is the square root of the variance, σ. If the distribution is positively skewed, then the highest value minus the computed mean minus minus .003 divided by three is the squared root of the variance. If the skew can not be determined, then the maximum of these values should be taken as the square root of the variance,
A no/yes, heads/tails, off/on transition which occurs at μ is a normal distribution. The
transition is from whatever choice is assigned a value of zero to whatever choice
is assigned a value of 1. Then the median choice is 0.5, the mean choice is 0.5, the true variance σ2 is 0.028, and the square root of that
variance, σ, is 0.167. According to the rule of normal distributions
this requires that:
0.3% of the transitions from 0 to 1 will be
made by μ-3σ, or μ-0.500;
5% of the transitions from 0 to 1 will be
made by μ-2σ, or μ-0.333;
32% of the transitions from 0 to 1 will be made by
μ-σ, or μ-0.167;
50%
of the transitions from 0 to 1 will be
made by μ;
68%
of the transitions from 0 to 1will be
made by μ+σ ,or μ+0.167;
95%
of the transitions from 0 to 1 will be
made by μ+2σ, or μ+0.333;
99.7% of the transitions from 0 to 1will be made by μ+3σ, or μ+0.500.
Mathematically there
is no difference between a transition that happens at μ+3σ and one that happens at μ-3σ. Or Biblically, the Parable of the Workers
in the Vineyard (Matthew 20: 1–16). It is wrong to say that there is no variance
in choice, transitions, even when there is no error. Mathematically there is a
definite non-zero variance with every choice.
No comments:
Post a Comment